

There is always a danger in basing an article on numbers. They can seem to be ultimate or penultimate goals when they should be neither.
Numbers, however, like a thermometer, can be a rough gauge of our current health. In that regard, looking at churches’ data can be a good exercise. Though the data is not determinative, it can be an indicator of health or the lack of health.
The largest group of data we have is from the Southern Baptist Convention (the survey instrument they use is called the “Annual Church Profile” or ACP). While that denomination may or may not be a good representation of your affiliation, it can at least give you a rough idea of national averages as a point of comparison.
Using 2019 as a Base
It can be instructive to use 2019 as a base since that year was the last pre-pandemic year. We really can’t use 2020 as a base, because most churches were closed during the year. And it can disguise the reality of the decline if we use either 2021 or 2022 as the base since most churches still had low attendance resulting from the pandemic.
The obvious bias of our numbers is that they represent one denominational group. The strength of using these numbers is that you have the data on over 40,000 churches.
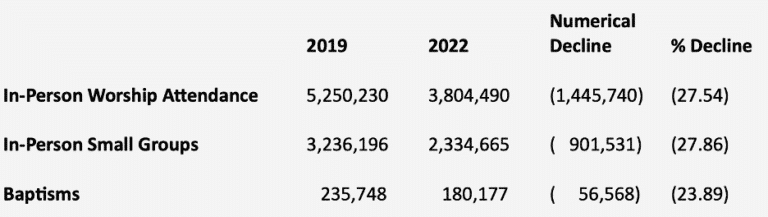
How Are the Churches Doing Since 2019?
We chose to look at three key data points for these churches: worship attendance, small group attendance, and baptisms. The latter category, baptisms, go by other names depending on the group: conversions, professions of faith, and others. Worship attendance represents every person attending, including children. The worship averages should be non-duplicating, meaning it only counts each person one time. Small groups go by a variety of names like Sunday school, community groups, home groups, life groups, cell groups, and, of course, small groups.
How Is Your Church Doing Since 2019?
I would encourage you to do a similar exercise for your church. Use 2019 as a base, and compare it to either 2022 numbers or your current numbers in 2023.
Again, this exercise is not one that lifts up numbers as the most important indicator of church health. But, at the very least, the numbers can give you a rough idea how your church is doing since the pandemic.
Posted on June 19, 2023
With nearly 40 years of ministry experience, Thom Rainer has spent a lifetime committed to the growth and health of local churches across North America.
More from Thom


2 Comments
Hey Thom,
Interesting and sad numbers. Knowing how reporting churches typically exaggerate numbers toward the positive and not the negative, what would be a more realistic appraisal of the decline in attendance? 35%? 40%? More? Less?
Bill –
On the surface, I would agree with your assessment. There does tend to be a “halo effect” when churches report numbers. The reason I am not sure it’s taking place with these numbers is the data we have from other sources. That data, from such sources as consultations and coaching, aligns closely with the SBC data I noted.