Assessment Tool

Know Your Community

A demographic and psychographic report of your community

The definitive, custom report that will help you reach and attract your local community.


Purchase in Bulk  Disponible en Español

$197

Frequently bought together

Getting More From Your Know Your Community Report

Why is knowing your community important?  Sam Rainer walks you through the Know Your Community report in this video series.  By knowing your community, you can better reach your community.

Know Your Community

A demographic and psychographic report of your community

Do you know your community?

Answer these questions:

– What is the median household income in your community?
– What is the percentage of married households?
– What is the percentage of Millennials?
– What is the breakdown of age, race, and employment industry?
– What percentage regularly attend religious services?

View Sample Report

You can’t reach your community if you don’t know your community.


If you have a hard time answering basic demographic questions about your community, then you need our custom research to provide the data your church needs.

Why rediscover your community?

  • It helps you understand your mission field
  • It deals with false perceptions
  • It points out needs the church can meet
  • It gives your prayer ministry a new focus
  • It reignites your passion for evangelism and ministry
  • It shows you what your church should stop doing
  • It helps you discover trends headed your way
  • It gives you insight for a good church budget
  • It points you to how your staff should do ministry
  • It helps you to understand how to best utilize your facilities

Get the report that answers the
WHO and WHAT of your community

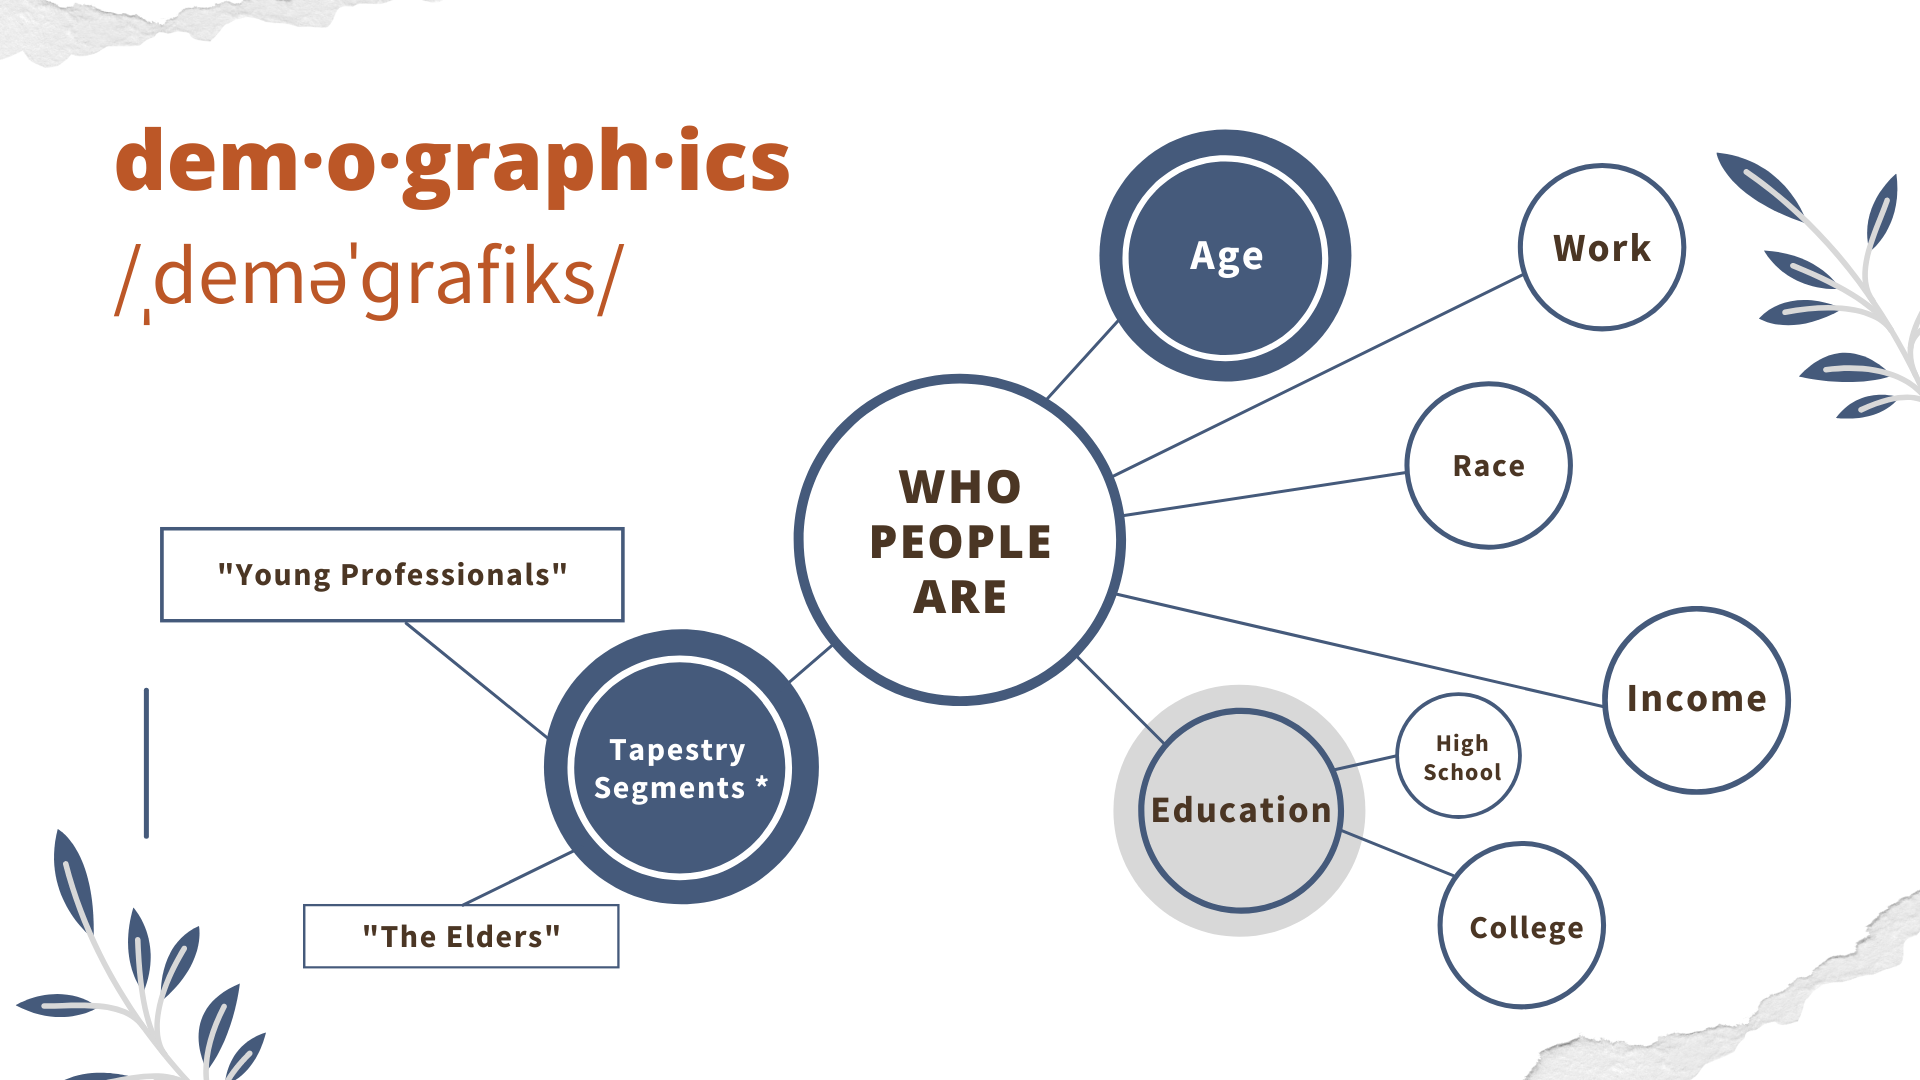
Demographics are who people are.

Common demographics include age, gender, and ethnicity. These attributes are often external features not related to what a person believes or how a person behaves.

* Tapestry segmentation classifies neighborhoods into sixty-seven unique segments based on both demographics and psychographics. Several easy-to-understand terms are used to describe communities.

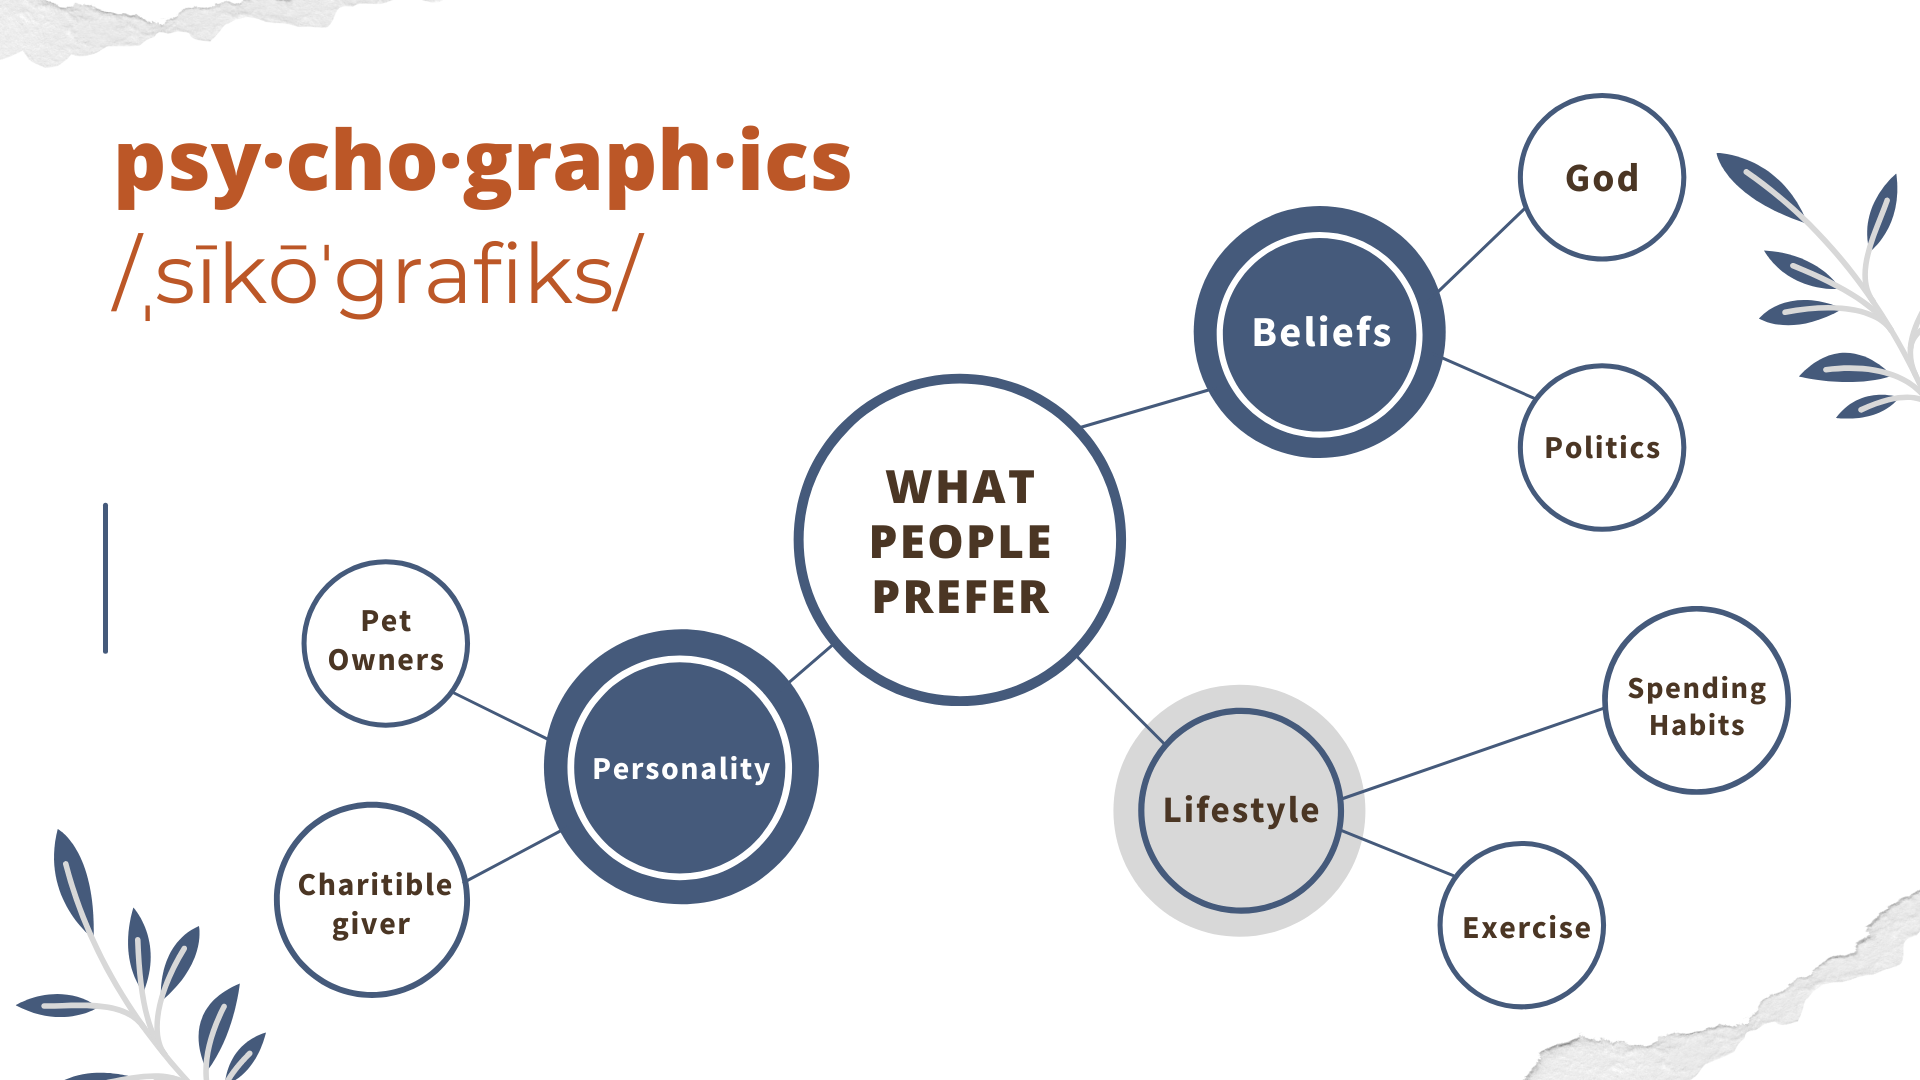
Psychographics are what people prefer.

Common psychographics include motivations, beliefs, and priorities. These attributes are often internal features that are impossible to know without asking. This is data that cannot be derived from census data or market reports.

See how this one report will help you effectively reach your community

This report is for your church if…

❌ Your guests don’t look like your community
❌ Your church doesn’t represent your neighborhood
❌ Census reports and public data are limiting
✅ You care about your church’s surrounding community
✅ You want to be more effective in local evangelism
✅ You want to attract your neighbors and make an impact

Money-Back Guarantee

We offer a 30-day, no-questions-asked refund policy. If for any reason you’re not satisfied with your purchase or the quality of the materials in the Know Your Community Report, you have 30 days to get a full refund.

  • “The Know Your Community report was eye-opening for our church… We are re-emphasizing children’s ministry with staff and budget to prepare to minister to many new young professionals that are starting families. We also discovered that those in our community are highly interested in health and fitness. We are now brainstorming youth and young adult outreach efforts based on these interests.”

    Ryan Flanders, Developmental Pastor
    Choice Baptist Church of Fredericksburg, VA
  • “The Know Your Community Report not only revealed that we were out of touch with our community it provided valuable insight for ministry opportunities. Over the past year the Know Your Community Report has been the primary resource for staff and church leadership as we pray, discuss, and plan our local outreach efforts.”

    Jeremy Atwood, Senior Pastor
    Immanuel Baptist Church of Glasgow, KY

What's in the Know Your Community Report?

  • Two key attributes often used to describe a particular group of people: Demographics (who people are) and Psychographics (what people prefer).
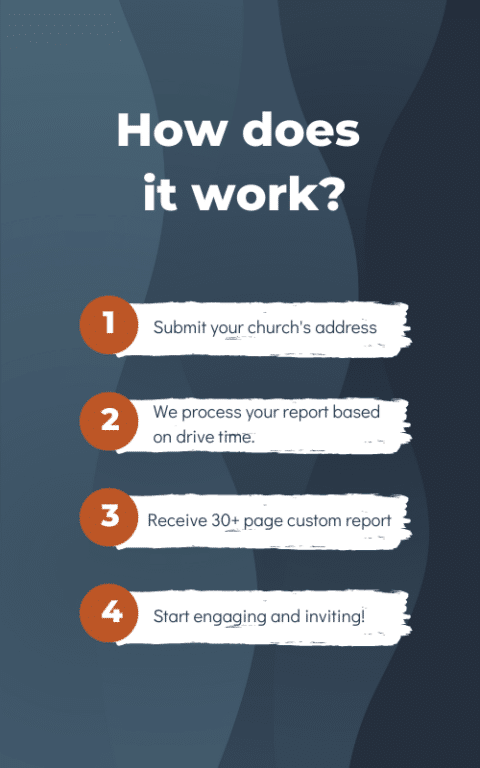
  • Boundaries of the community are defined by drive time. Common drive time is 10 minutes.
  • We partner with ESRI to create the reports. ESRI’s software is the most powerful mapping and spatial data technology available.

Related Video Resource

Frequently Asked Questions

  • Is this actually a custom report for my church?

    Yes! Your church’s address is unique, and so is your local community. Our system goes well beyond census and public data. We do not have any pre-made reports. Everything about your report is based on your church’s immediate area.

  • How long does it take to get my report?

    After your purchase, we will automatically send you a link to submit your church information. It will take 3-5 business days for us to create your custom report and return it to you.

  • Why is the report based on “drive time?”

    In most cases, we use drive time to determine the boundaries of the community. Common drive times are ten minutes (for more dense communities) and twenty minutes (for less dense communities).

  • Why is the report not based on radius?

    A radius definition often draws in features that distort data. A large lake or a major highway can alter the results when included in a radius. Drive time works around these distortions for a clearer picture of the true community.

  • Why doesn't the report use zip codes for reporting?

    Other reports use zip codes to determine the community, but most people do not quickly recall where one zip code ends and another begins. In select cases, we will use either a radius or zip codes to determine the boundaries of the community. Some locations require a different approach than drive time.

More Questions?

Contact us at 615-669-8201 or email [email protected] for assistance.